RenderDoc
RenderDoc Overview
RenderDoc is a stand-alone graphics debugger that lets you capture and inspect a single frame of any application.
You can use RenderDoc with Magic Leap 2 for various purposes, such as:
- Debugging a shader
- Viewing pixel history
- Viewing a specific texture
Prerequisites
Before you use this guide, make sure you have:
- Magic Leap Hub installed
- Magic Leap 2 device configured for use with your computer, either via WiFi on the bridge, or with a USB cable connecting the Magic Leap 2 device to the computer you're using for development. Learn more
Install RenderDoc via Magic Leap Hub
You can install RenderDoc from the Magic Leap Hub by following these steps:
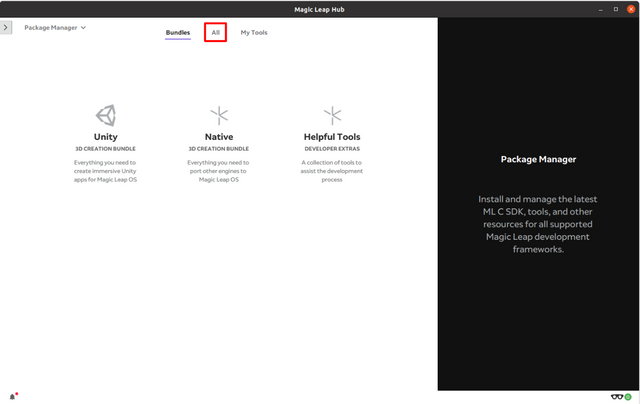
- Open the Magic Leap Hub and navigate to the Package Manager.
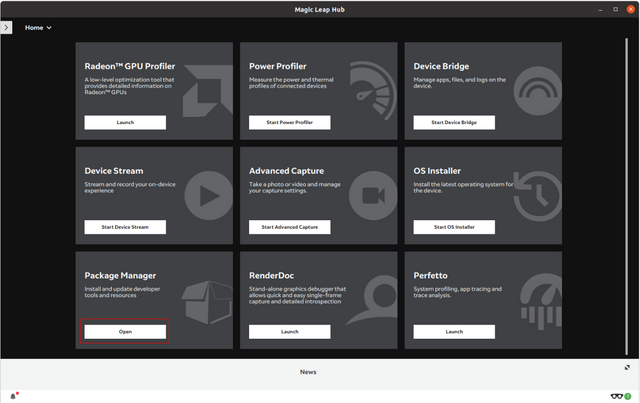
- Click the All icon.
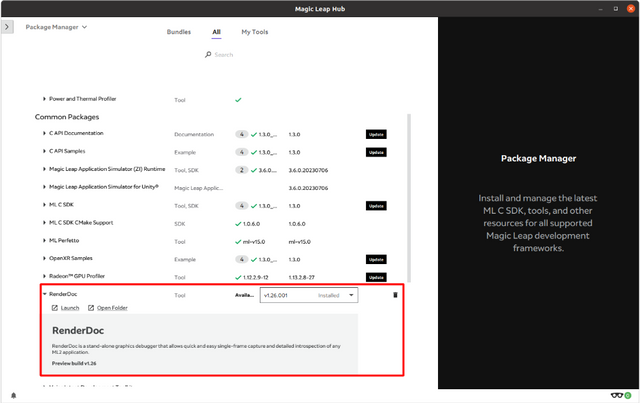
- Find the RenderDoc package in the Common Packages category. Download the latest version.
- Add the adb binary to your PATH Environment variable. This ensures RenderDoc can communicate with the Magic Leap 2 device. For Windows users, the path would be something like:
C:\Users\_user_\MagicLeap\MLHub\plugins\com.magicleap.adb.win32.x86_64_1.0.41.28_0_2_202304071616\adb\adb.exe
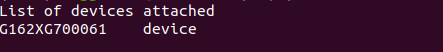
- Verify that you added the adb binary correctly by opening a command prompt window and running the following command:
adb devices
You should see your Magic Leap 2 device listed, confirming a successful connection.
- Locate the Render Doc Tile in the Magic Leap Hub.
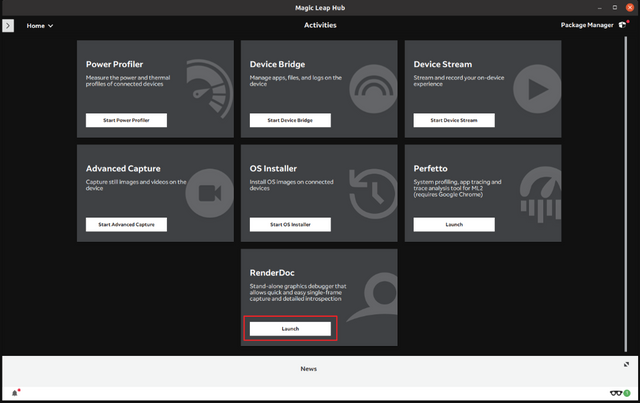
Launch RenderDoc
RenderDoc Tool
You should now have RenderDoc installed, and you can move on to taking a capture to work with in RenderDoc.
Take a Capture with RenderDoc
This section walks you through how to take a capture with RenderDoc that you can use for analysis. Do the following:
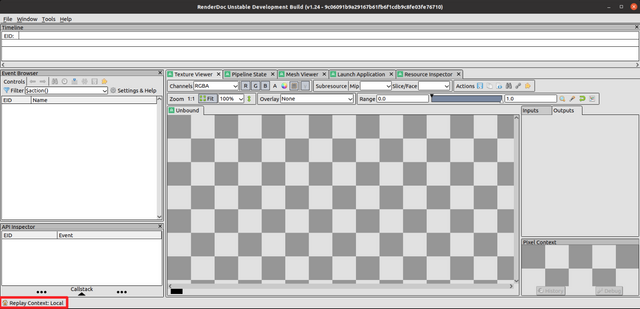
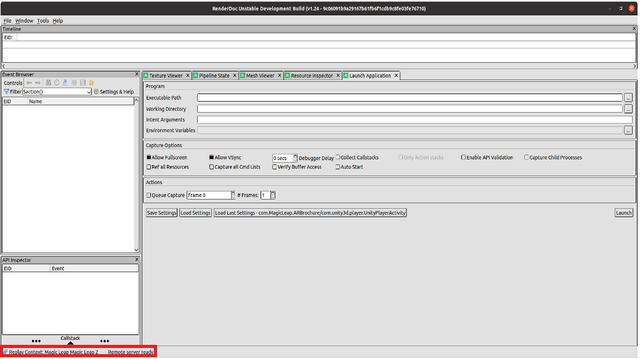
- In the RenderDoc window, click Replay Context: Local in the bottom-left corner. A drop-down menu appears with the Magic Leap 2 device as an option. Click the device to connect to it.
The bottom status bar displays Remote Server Ready when the connection is successful.
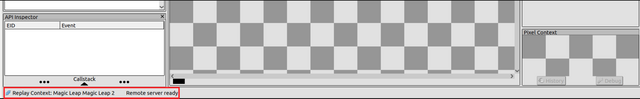
If you connect the device after opening Renderdoc, it may take a few seconds for it to connect.
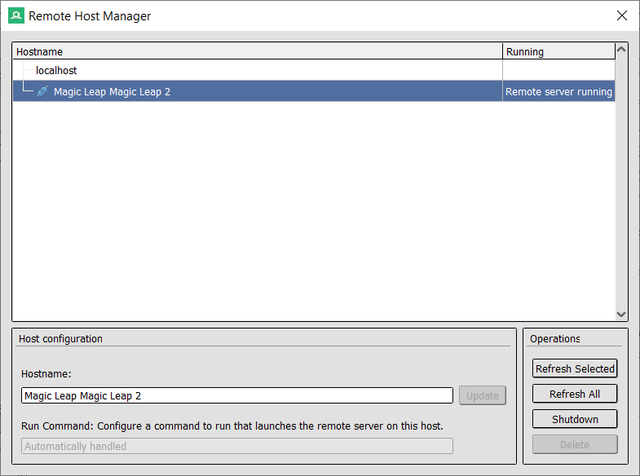
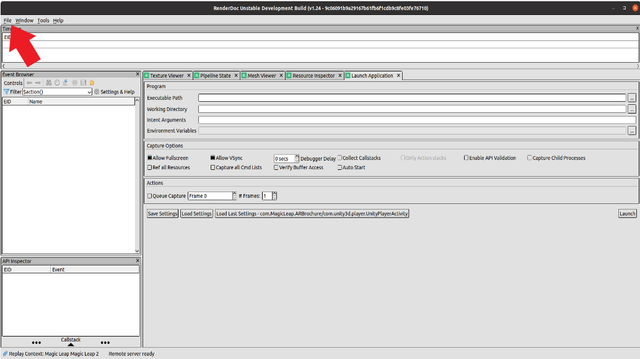
If you want to check if the device is detected, you can navigate to File > Attach to Running Instance. This opens the Remote Host Manager and you can see if the device has the server running on it that allows RenderDoc connection.
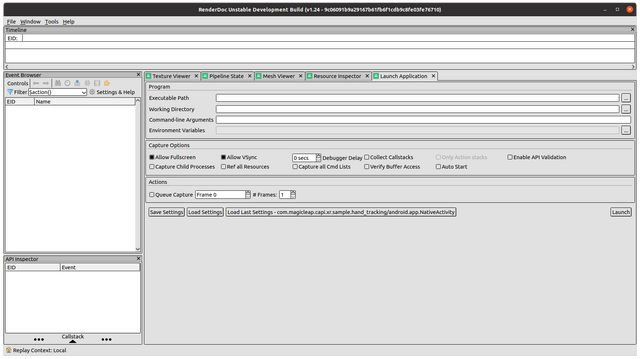
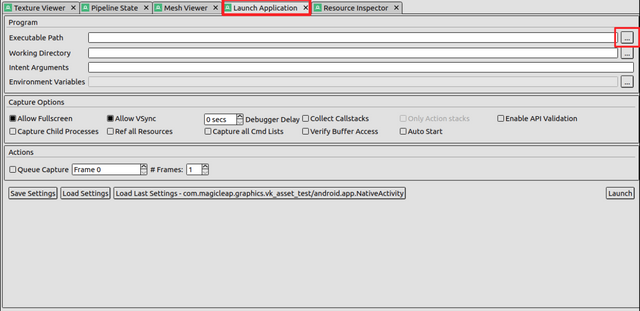
- Go to the Launch Application tab and click the |…| at the end of Executable Path. Browse the device for applications you want to run from inside RenderDoc and select one.
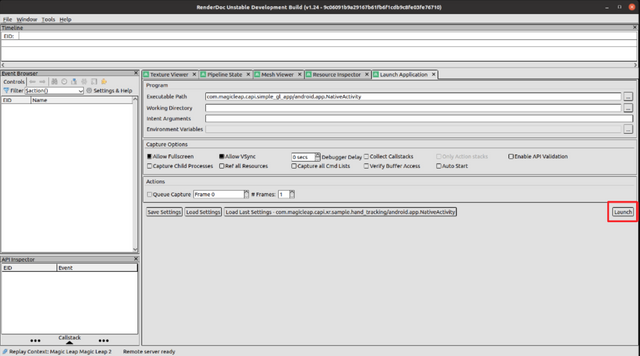
- Click Launch to start the application.
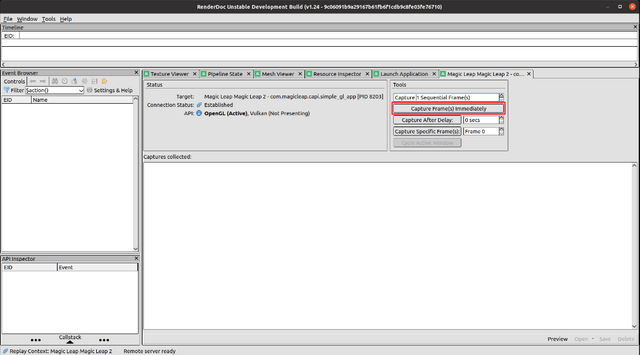
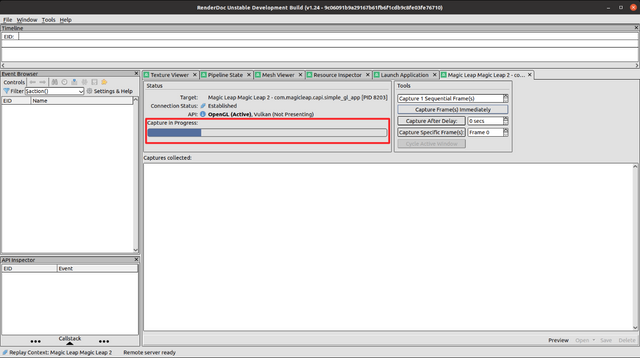
- The app runs on your device. Within RenderDoc, a capture window opens. Click the Capture Frame(s) Immediately button to take a capture.
- A progress bar appears when the capture starts. Wait for the capture to complete.
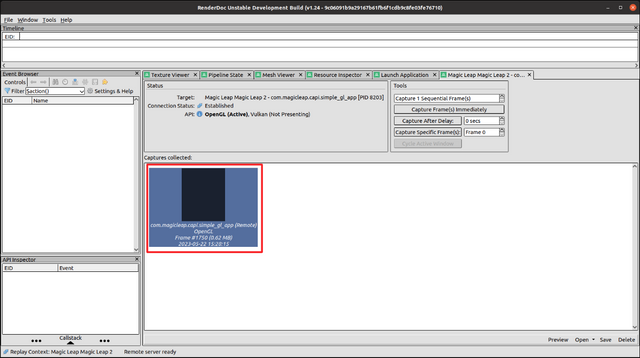
- Right-click the capture inside the Captures Collection section and choose Save As... to save the capture.
- Close the application inside the Magic Leap 2 or open the file on your computer to view the capture.
You now know how to create and view a capture with RenderDoc.
How to Analyze Your RenderDoc Capture
There are a number of resources you can use to learn how to analyze your RenderDoc capture. They're all created by RenderDoc and provided here for convenience. Resources to review include:
- How Do I? - A RenderDoc page that lists commonly asked questions and provides tutorials for each.
- How to debug a shader
- How to inspect a pixel value
- How to view a specific texture
- How to edit a shader
Additionally, we offer Magic Leap-specific tutorials about:
These follow in the next sections. Instructions for each assume you completed RenderDoc installation and collected a capture.
Debug a Shader
Shader debugging in RenderDoc allows you to run step-by-step through a shader at a given time in the frame and make sure the right shader is used at the right time.
- Make sure RenderDoc is open and connected to Magic Leap 2.
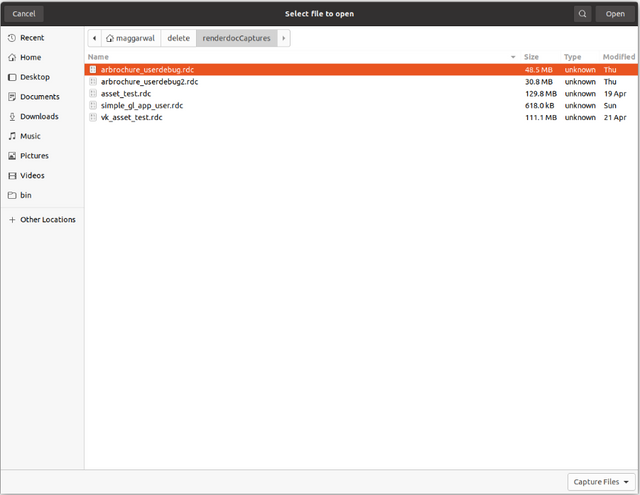
- Select File > Open Capture.
- Choose a capture from the list and double-click it to open it.
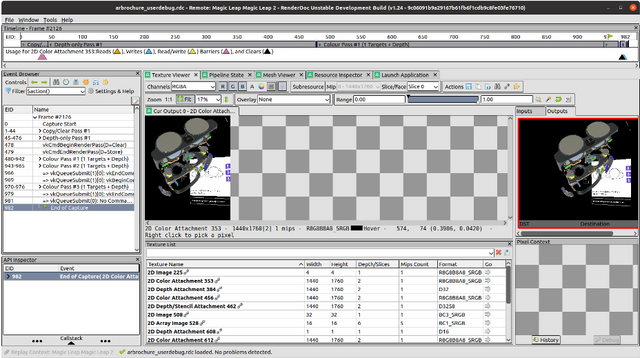
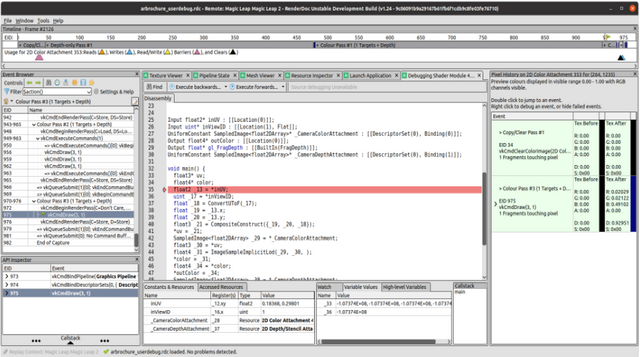
- When you open a capture, you should see a view like this:
- Select a draw call and right-click a pixel in the viewer on the left. You can debug the pixel from the Pixel Context window by selecting Debug.
- A Disassembly window should open with the associated shader that you can step through for debugging.
You can use this method to debug any shader as needed.
View Pixel History
Viewing pixel history is useful when you are debugging a specific part of the frame, for instance a corruption like an incorrect color showing up as part of a final image. Pixel history helps you understand which operations influenced the specific area you are viewing and you can step through each operation to see its state at a given moment.
- Make sure RenderDoc is open and connected to Magic Leap 2.
- Click on File > Open Capture at the top.
- Choose a capture from the list and double-click it to open it.
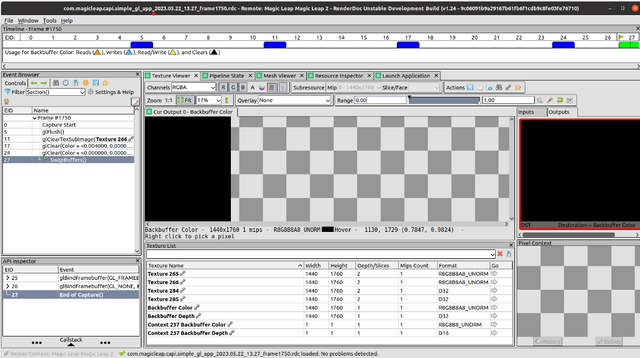
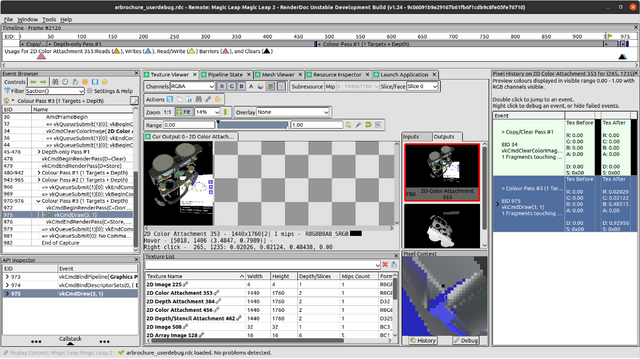
- When you open a capture, it should show a view similar to this one:
Hover over the texture in the viewer on left to show pixel information below the texture.
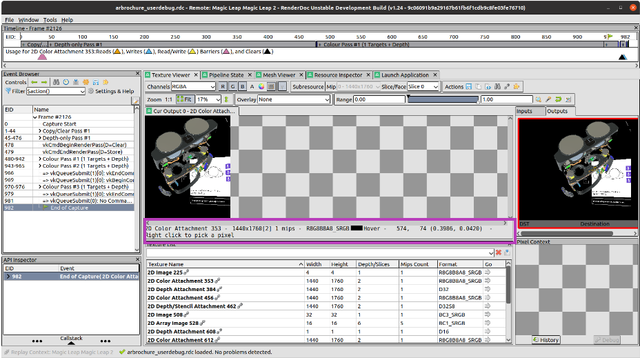
RenderDoc Pixel Info Right-click on the mouse to pick the pixel for analysis.
- In the Pixel Context window, select History to view the pixel history.
- In the Pixel History panel, you can view every change made to the selected pixel from the start of the frame to the current event.
- Double-click an event to jump to that event in the replay.
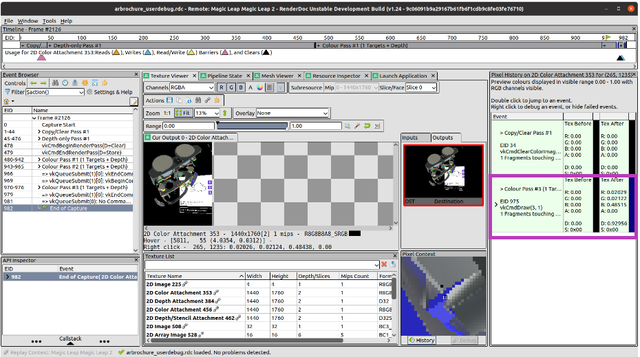
- View and verify the state of the pixel at that event.
You're able to use this guide to take a look at pixels in any captures you like.
View a Specific Texture
Viewing a specific pixel texture can help you ensure the texture states (onscreen and offscreen) at that point in the frame are correct. You can verify texture format, size and contents this way.
- Make sure RenderDoc is open and connected to Magic Leap 2.
- Click on File > Open Capture at the top.
- Select a capture from the list of displayed captures and open it by double clicking on it.
When you open a capture, it should show a view similar to this one:
RenderDoc View Capture After you open a capture, in the Texture Viewer, click the Open Texture List button.
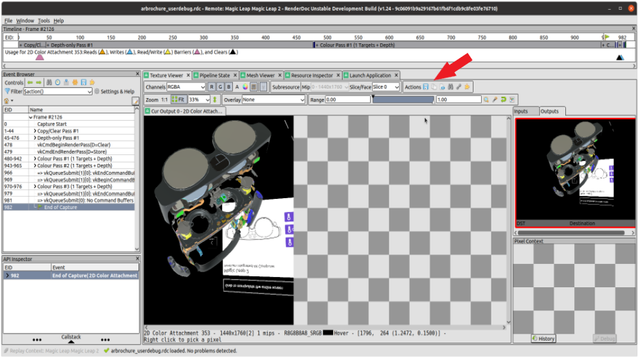
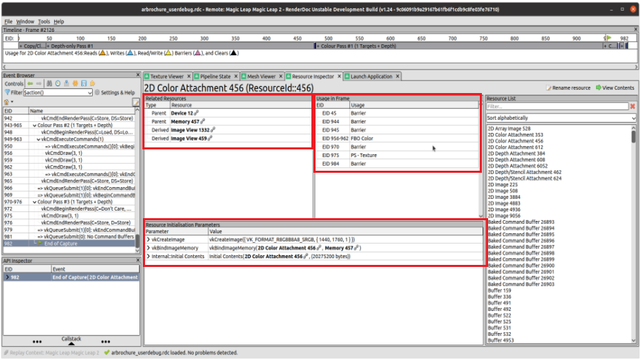
Click on a texture name to open its resource details.
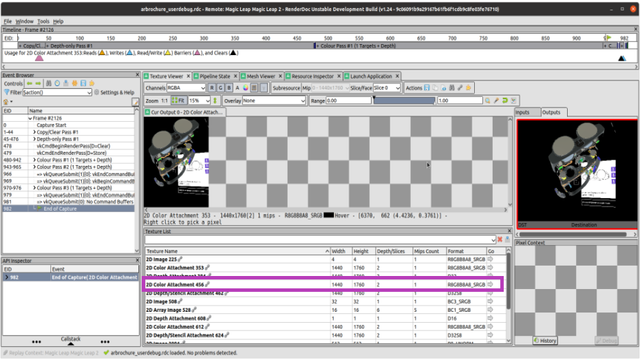
RenderDoc Click Texture Name In the texture resource details, you can view the initialization parameters, usage in frame, and related resources.
You can view any pixel texture in your capture with these instructions.
Suggested Settings
Magic Leap suggests the following settings for Renderdoc:
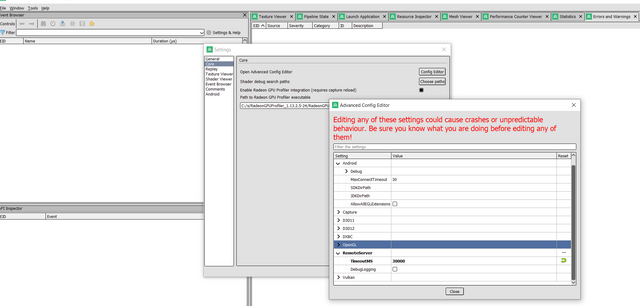
Navigate to Tools > Settings > Core > Open Advanced Config Editor > Remote Server > TimeoutMS.
Set the value to 30000 or up to 60000. This increases the time Renderdoc can spend waiting for an action sent to the device to complete. This helps in cases where the USB connection is slow and the default lower timeout (5000) may cause issues opening or taking captures on device.
Known Issues that Can Affect a RenderDoc Capture
The following are known issues when taking a RenderDoc capture:
- For memory heavy applications, the Magic Leap 2 device has issues taking Renderdoc captures. You can work around this issue by closing background apps to free up some memory.
- For GPU heavy applications, Renderdoc captures can cause the GPU to freeze. This happens as Renderdoc also adds to the load while capturing. If encountered, the device will need to be rebooted.