Power Profiler
Power Profiler
The power profiler helps you diagnose which facets of your application drive high power consumption. This guide walks you through installing the power profiler, and provides sample analysis using the power profiler.
Prerequisites
For this walkthrough, you need:
- Magic Leap Hub
- Magic Leap Headset
Get Started with the Power Profiler
This section walks through how to set up the Power Profiler for use. To set up the Power Profiler, do the following:
Install the Power Profiler from Magic Leap Hub’s Package Manager.
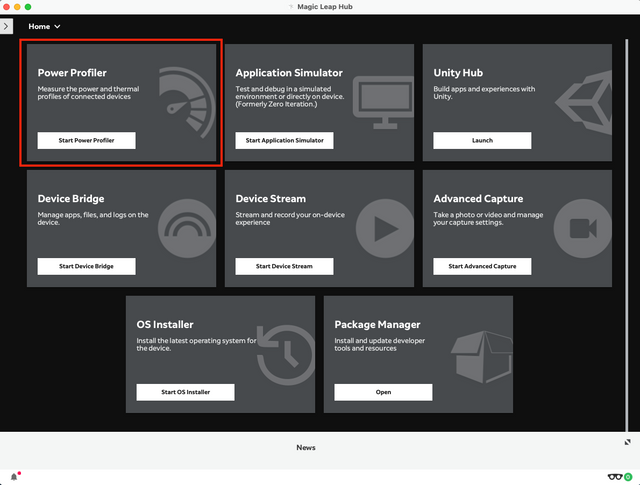
After installation, the Power Profiler tile appears on the home view. Click Start Power Profiler to launch the app.
Make sure your ML2 compute pack is connected to your host computer via USB cable.
In the tool bar, you will see an icon shaped like a play button. If you click the button, it begins recording instantaneous power and thermal data across multiple domains. In the scope of this document, only power is covered.
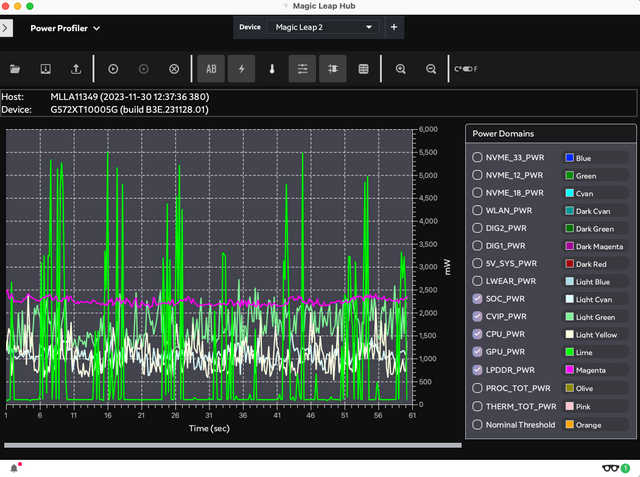
- To isolate the power domains you can click each of the checkboxes in the right hand column to hide/reveal each component on the chart.
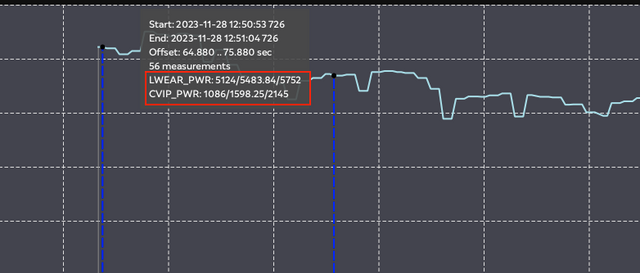
- If you click and drag across the graph, you see a dialogue box that reveals a new set of metrics next to each component. The way it is formatted is like this:
COMPONENT_NAME: min(mW)/average(mW)/max(mW)
Magic Leap recommends looking at average power as it provides a more consistent measure of your device's energy usage over time. The top domains to look at are CPU, GPU, and LPDDR. A bottleneck that causes excess power draw is typically evident in one of these components.
Turn off automatic brightness when sampling power data. Automatic brightness can cause unwanted fluctuations in your measurements.
You should now have the Power Profiler set up, so you are ready to take a look at the case study using the Power Profiler. Before moving on to the case study, measure a simple use that has stable power metrics, such as Home Menu. By dissecting Home Menu's power consumption component by component, you can establish a baseline. This becomes a standard against which to measure any application.
Case Study
In this case study, you'll use the Power Profiler to determine which facet of your application drives high power consumption.
The scenario: You've stumbled upon a peculiar case with your latest application. Despite its simple functionality, it's guzzling power at an alarming rate. To dissect the issue, you can use the Power Profiler, capturing a detailed 60 second session that lays bare the application's power usage patterns.
To analyze the capture, do the following:
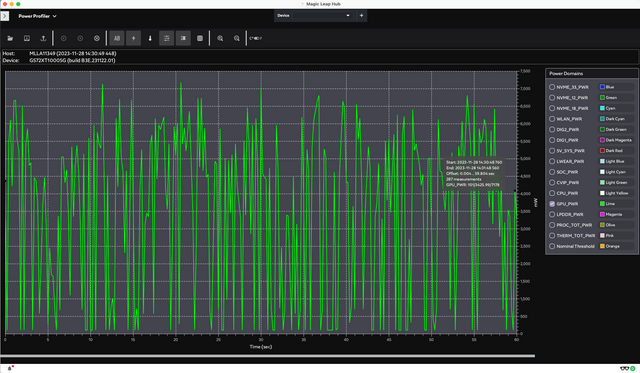
Systematically isolate each component to identify which domain is an outlier. In this instance, it's evident that the GPU power consumption stands out at an average of 3425 mW.
Compare the GPU power consumption to the baseline collected for Home Menu. In this example, it consumes 650 mW of GPU when in idle. This indicates that our sample app is calling heavily on the GPU. This is a stand-out signal that there is a rendering behavior in our application that should be more closely examined.
Now that you've located the issue, you can determine how to optimize rendering performance by using tools such as RenderDoc or Radeon GPU Profiler.
A RenderDoc analysis reveals that you are rendering a heavily un-optimized model in your scene, consuming 35% more GPU resources compared to your optimized models. This results in a 20% increase in frame rendering time and approximately 15% higher power usage.
You've now completed an example scenario where you used the Power Profiler to find power consumption issues in your application.