Radeon GPU Profiler
Radeon GPU Profiler (RGP) is a tool that helps you analyze the performance of your graphics applications on AMD GPUs. It captures a single frame of rendering and shows you how the GPU executes it, including the time spent on each draw call, pipeline state, shader, and memory operation. This document explains how to install RGP and provides an overview about how use it with a Magic Leap 2 device. For more information about RGP, see the official RGP documentation.
About Radeon GPU Profiler
Radeon GPU Profiler (RGP) is a single-frame profiler. That means that each capture operation profiles one and only one frame, whichever frame is being rendered at the time you initiate the capture. You can profile as many frames as you want, but each one is an independent operation and resulting file.
RGP, unlike other profiling tools, doesn't allow you to launch an application from the tool, for the sake of profiling it. The application needs to be launched independently (for example, via the home menu or adb). While the process need not be launched in any special way, RGP does require you to have the Radeon Developer Panel (RDP) running and connected to the device before you launch the target application. RGP discovers newly launched graphical processes and then gives you the ability to profile it.
Prerequisites
To use RGP, you need to have the following:
- Magic Leap Hub
- adb
- Magic Leap 2 device connected to your computer
Install Radeon GPU Profiler (Linux and Windows Only)
This section guides you through the steps to install RGP.
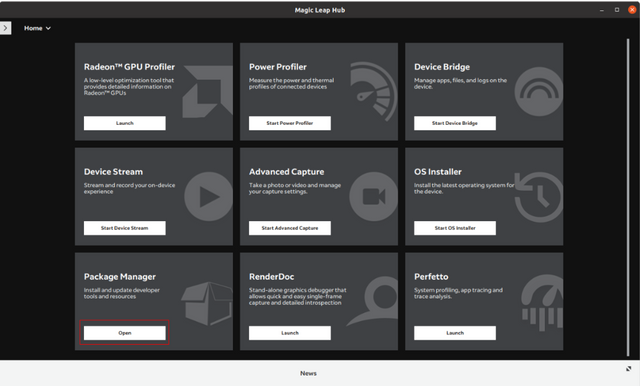
Navigate to the Magic Leap Hub.
In the Magic Leap Hub, open the Package Manager.
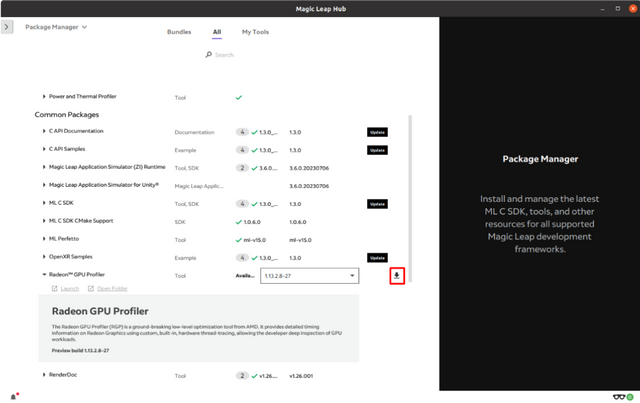
- Select the All tab.
- Find the Radeon GPU Profiler package under the Common Packages category. Download the latest version.
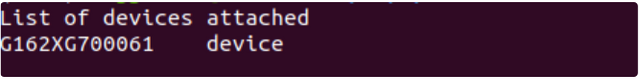
- Verify that you have access to adb by running the following command in your prefered CLI (ie: Command Prompt ). You should see your device listed as connected.
adb devices
Connect your Magic Leap 2 device to a private WiFi network with password protection. Public WiFi networks will not work because they block peer-to-peer connections.
Execute the following command to get the IP address of the connected Magic Leap 2 device:
adb shell ip -o -h -c a #reveals the IP address of your device under wLan0
The output will list various network interfaces. Look for wlan0 and note the IP address. The IP address of your device is the part after inet and before /24, which in this example is 192.168.1.100.
Sample Output:
1: wlan0 inet 192.168.1.100/24 brd 192.168.1.255 scope global wlan0
- To verify the connectivity, run the
pingcommand with your device's IP address:
ping <device-ip-addr> #contacts the device via WiFi to verify connection
Replace <device-ip-addr> with the IP address obtained in the previous step. If the device is reachable, you'll see output with statistics. For example, ping 192.168.1.100 would result in something like this:
Sample Output:
Pinging 192.168.1.100 with 32 bytes of data:
Reply from 192.168.1.100: bytes=32 time=2ms TTL=64
Reply from 192.168.1.100: bytes=32 time=1ms TTL=64
Reply from 192.168.1.100: bytes=32 time=2ms TTL=64
Reply from 192.168.1.100: bytes=32 time=2ms TTL=64

Ping statistics for 192.168.1.100:
    Packets: Sent = 4, Received = 4, Lost = 0 (0% loss),
Approximate round trip times in milli-seconds:
    Minimum = 1ms, Maximum = 2ms, Average = 1ms
If the ping fails, then your device and PC are not accessible to each other on the network. You need to make sure your device is connected to the same private WiFi as the host.
- You can launch RGP using Python 3 if you have it installed, or with the Magic Leap Hub or command line.
Option 1: Python 3 Method
- Navigate to the RGP installation folder.
- Execute the following command:
./rdp_android.py --target <device_ip_addr>
- If the connection is successful, you see a green dot next to Connection. This means your devices are connected and ready to communicate, and RGP detects any new graphics processes on your device.
Option 2: Magic Leap Hub + Commandline Method
- Open a command-line terminal and run:
adb shell /vendor/bin/RadeonDeveloperServiceCLI
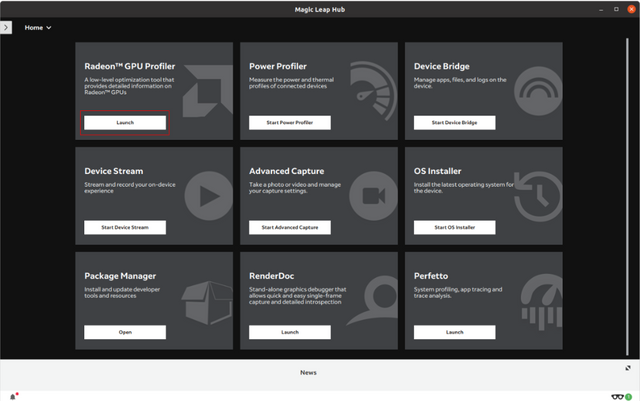
- Navigate to the Magic Leap Hub and launch RGP by finding the RadeonTM GPU Profiler and clicking Launch.
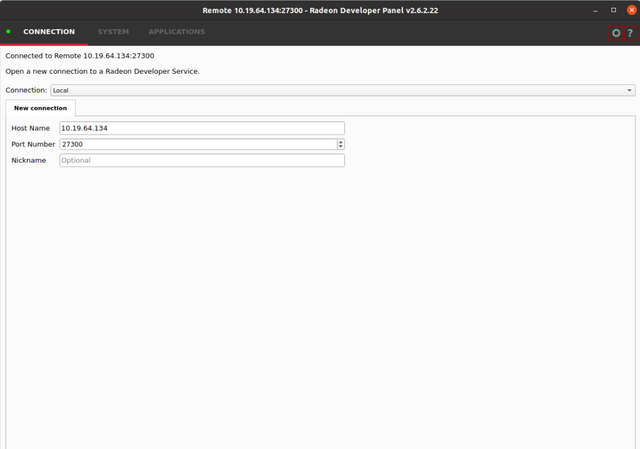
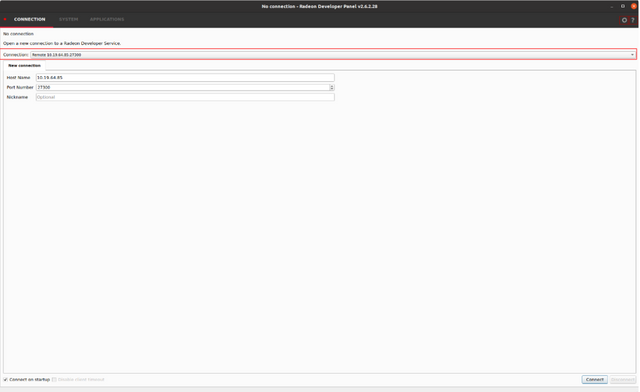
- You see a dialog box asking you to set the connection. Choose Remote <ip_addr> from the Connection dropdown menu.
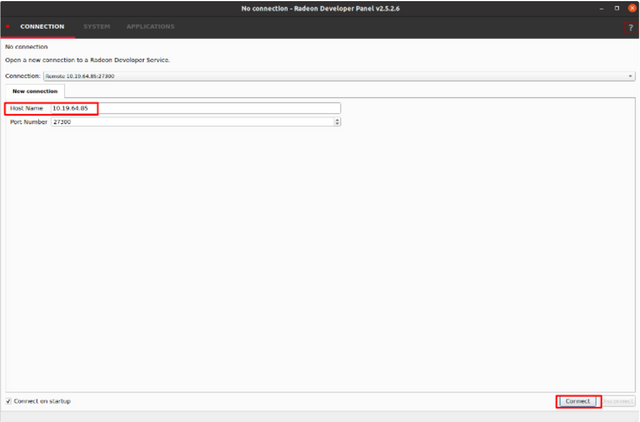
- Enter the Magic Leap 2's IP address under Host Name. Make sure the port number is 27300. Click Connect.
- If the connection is successful, you see a green dot next to Connection. This means your devices are connected and ready to communicate, and RGP detects any new graphics processes on your device.
Image Based Tutorial for Using Radeon GPU Profiler
This tutorial demonstrates a common use case with RGP: analyzing the draw time of your application. Draw time is the time spent by the GPU to execute the draw commands issued by your application. Before starting this tutorial, make sure you complete the installation and connection steps described in this document.
This tutorial shows you how to look at draw time. Use the following steps to try analyzing draw time with the Radeon Developer Panel:
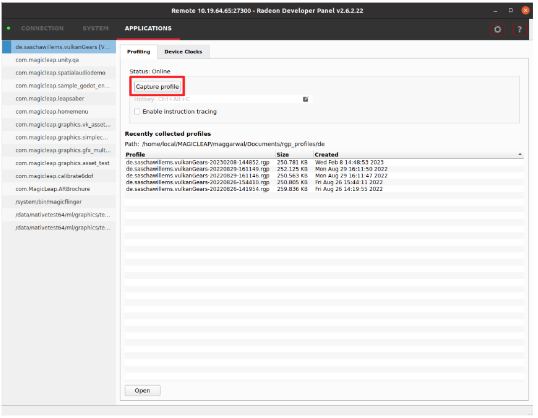
If you just connected your device to RGP, you should see a screen with a green dot indicating that your device is ready for profiling. If not, reconnect your device following the previous instructions in this document.
Launch your application on the device. If it is already running, close it and restart it.
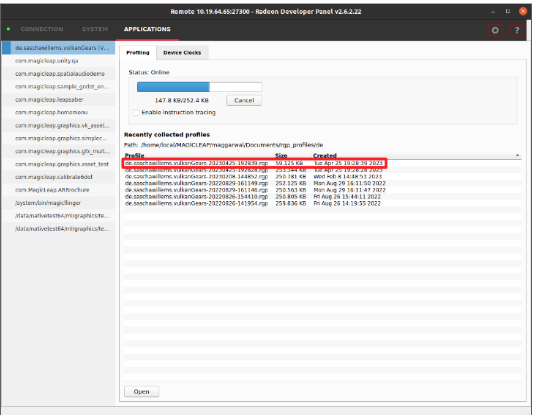
With the application running, click on the Capture profile button.
- When the profile capture completes, select the profile from the list in RGP.
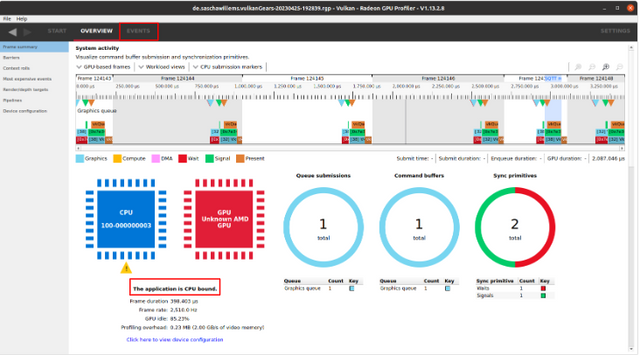
An Overview of the frame summary should open in RGP. It shows you whether your application is CPU-bound or GPU-bound, and provides some statistics about the frame. Next, click on the Events tab on top.
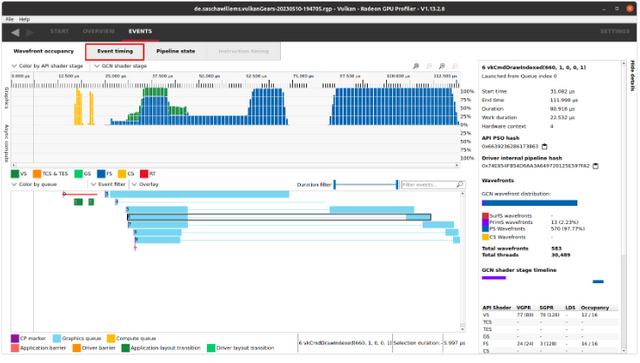
Draw Frame Summary Click on the Event timing section in RGP. Here you can see details of the API calls made by your application and the driver, such as their duration and order.
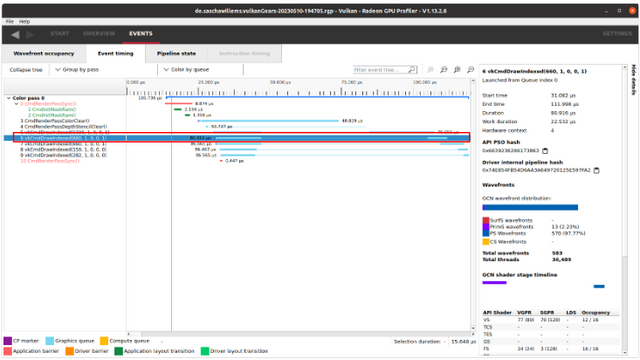
- Here’s a breakdown of all draw calls made during the capture in RGP. In this example, we see that one draw call took 80.916 µs or 0.080916 ms to execute on the GPU.
You now know how to analyze draw time with RGP.
Known Issues with Radeon GPU Profiler
Here's a list of known issues for profiling apps with RGP:
- For heavy Unity applications, trying to capture RGP can cause the GPU to freeze.
- The application may become unresponsive or unstable after RGP capture and require a restart.
Troubleshooting Radeon GPU Profiler
If you encounter any issues with RGP, please contact Customer Care for assistance. RGP is a proprietary AMD tool, but our Dev Tools team provides tier 1 support. They will open a ticket with AMD as needed. Please provide the RGP log file when reporting an issue:
- Windows:
C:\Users\<name>\AppData\Roaming\RadeonDeveloperPanel\log.txt - Linux:
~/.local/share/RadeonDeveloperPanel/log.txt