Developer Hud
Developer HUD is a feature meant to allow applications to view metrics related to system performance without being tethered to a laptop/desktop. It should help give developers a good idea of how the system is performing frame to frame. A good time this can be used is when a developer would like insight into the system metrics during underperforming sections of their application. It can help get a broader view of where the problem may be.
This feature is only available on Magic Leap OS v1.9.0 or higher.
Understanding the HUD Graphs
Each performance metric is represented by a graph on the Developer HUD. Recorded data is colored in blue. Additionally, there are 2 guidance lines to help interpret the load on the system for the specific metric.
Yellow Warning Line
This line indicates a “warning” level. If you have not crossed the yellow line, this means the system is acting ideally under the workload provided. However, when you cross the yellow line, this means the application is approaching a point where optimizations should be investigated. This is mostly a guide. It is best for applications to not cross this line when possible.
Red Error Line
This line is the “error” line. This means the application workload has gone beyond what the system can handle, and it should be expected to see artifacts or that the interactions may not be as smooth as otherwise could be.
Available Metrics
Currently the list of metrics available through Developer HUD will be FPS, GPU time, CPU time.
FPS (Frames Per Second)
The number of frames per second. This is calculated by taking the average time taken by the last 16 frames in a sliding window fashion. For smooth performance, this should be as close to 60 as possible, and should not drop below 59.
GPU time
The time spent by the application running on the GPU during the previous frame. For a smooth experience, applications should aim to keep this below 12 ms. It will always be preferable to reduce the value as much as possible.
CPU time
The time spent by the application running on the CPU during the previous frame. This is measured as the time spent between BeginFrame and EndFrame on OpenXR. For a smooth experience, applications should aim to keep this below 12 ms. It will always be preferable to reduce the value as much as possible.
We generally expect the CPU + GPU time to be less than 12ms for default settings i.e. without any additional features such as occlusion or depth assisted warping enabled. Additionally, while the individual GPU/CPU time for the application is below 12ms, developers would need to be wary about not exceeding the combined 12ms boundary for these metrics as well. The HUD will contain graphs with guiding benchmark indicators on them for convenient visualization.
Enable Developer HUD
To enable Developer HUD on your Magic Leap 2 device, follow these steps:
Step 1: Enable Developer settings
The feature is part of developer settings which are not enabled by default. We need to enable them first. Here is a video tutorial explaining the steps required to do so: How to enable Developer Mode.
Step 2: Set Up ADB
You will need to run a command to enable a property on the device through the terminal. It will require you to connect the device to a host machine and set up adb which is the software used to communicate with android devices. Please follow the guide here: ADB Setup | MagicLeap Developer Documentation
After enabling Developer Mode and setting up ADB, connect your device to your host machine and run:
adb devices
List of devices attached
G772XT100049    device
This command should return a list of connected devices, confirming that your device is ready.
Step 3: Enable Tracing
To activate tracing on your device, run the following command in your terminal:
adb shell setprop persist.traced.enable 1
This command only needs to be run once, as the setting will persist across reboots.
Step 4: Reboot the device
Reboot your device for the changes to take effect.
Step 5: Enable the Developer HUD
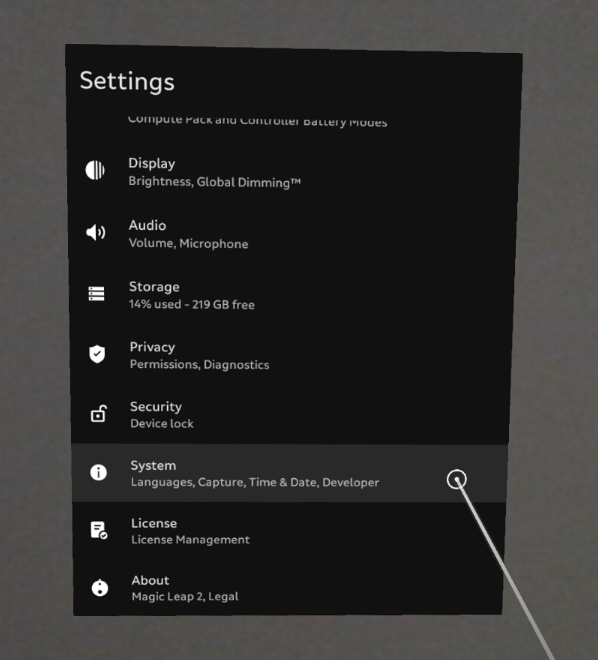
Navigate to the Developer HUD setting in the Developer options menu and enable the Developer HUD.
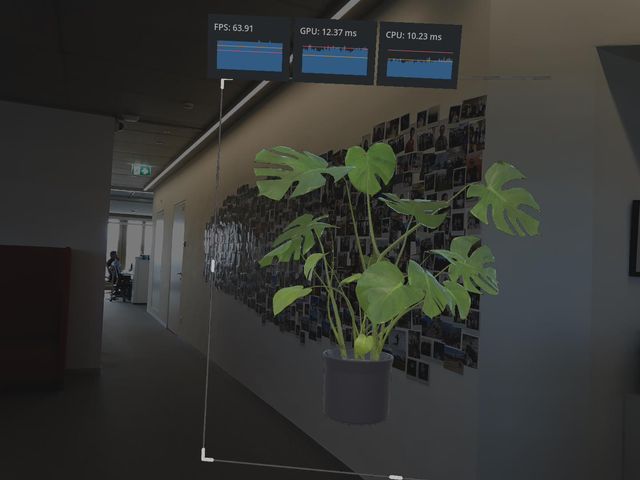
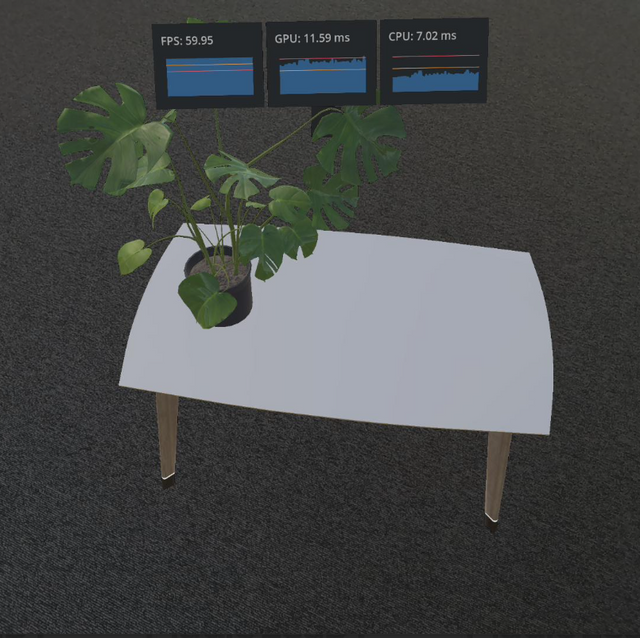
The HUD should now be visible inside applications as shown below.
Investigating Further
The Developer HUD is meant to provide useful real-time information for the application developers to respond to. However, that is not always going to be enough. In these cases, it is useful to send additional data to Magic Leap and allow us to help guide.
To ensure this is as seamless as possible, an additional tool is made available for developers: Metric Logging. Metric Logging works by enabling the developers to turn on logging of the metrics from the HUD in a way that Magic Leap can read and understand. These are all metrics of the device and its health during the time period gathered. This does not contain any data about profiles or any personal identifiable information.
Here’s how to run the tool:
Step 1: Enable Data Recording
Before running your scenario, enable data recording by running:
adb shell setprop ml.graphics.apfl.record true
Step 2: Disable Data Recording
After completing your test scenario, disable the recording by running:
adb shell setprop ml.graphics.apfl.record false
Step 3: Gather a Bug Report
Gather a standard bug report from the device by running the following command in the command line:
adb bugreport
Alternatively, you can use the ML Hub to capture bug reports by following this guide: Capture Bug Reports | MagicLeap Developer Documentation.