Using Application Simulator
The Application Simulator can fit into your workflow in a few different ways. To decide which target mode you want to work in, first decide where your input and world data come from. There are a few different sources this data can originate from.
Iterate on the Device
One option is to use a physical device connected to your PC via a USB-C cable or WiFi, which allows you to execute the app on the device but debug your project on the host computer. To do this execute the following steps:
- Connect a powered on device to your computer over USB.
- Open the Target selector.
- Select your device from the Target selector.
- Click Connect.
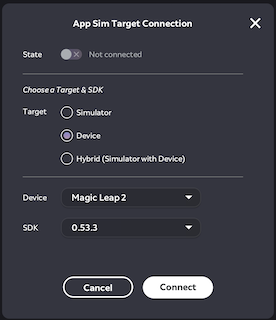
When iterating on the device only, you cannot manually edit the headpose transform (among other settings) in the Interaction window properties. This is to prevent the digital content of your app from misaligning with the world and to prevent impossible real world scenarios that may break proper simulation.
Iterate in Simulator Mode
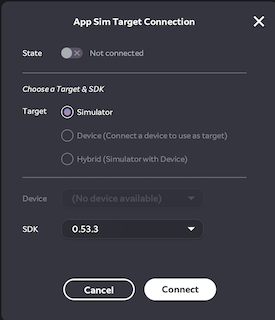
The other option for using the Application Simulator is to use the Simulator target. This provides headpose and world reconstruction data from the virtual environment of the simulation. You can use this even if you do not have a device, making it ideal for large development teams with limited hardware. Additionally, the Simulator creates an excellent testing environment by allowing simulation data to be saved and shared between developers or QA engineers.
- Open the Target Selector.
- Choose Simulator as Target.
- Click Connect.
The Simulator populates with a default .room file automatically when it starts. Modify this behavior in the settings from the Application Simulator menu (Application Simulator > Settings > Application Simulator > General > Default Session File).
When using the Simulator, the headset is initially placed at x:0.0 y:2.0 z:0.0. The controllers are placed somewhat forward and below that location, replicating typical hand positions. Modify this behavior in Settings from the Application Simulator menu (Application Simulator > Settings > Application Simulator > Simulator > Headpose > Starting Position).
You add to the virtual room layout by selecting the Add Room button in the Scene Graph panel's toolbar.

If you want to completely replace the room, click the Clear Scene button, and then the Add Room button.

Virtual rooms are created in the Room Generator tool.
Stopping Application Simulator
To stop the Application Simulator, toggle the Target State Selector to Disconnected.


Running your App
To run your app in Application Simulator, configure your existing Magic Leap app or game engine project to build code that runs on the host instead of the device. 3D engines have some other settings you need to configure as well.
C/C++ Apps and Custom Engines
Overview
The Application Simulator supports running programs on hosts which use the Magic Leap C SDK.
As with Magic Leap 1 (ML1) development, standalone applications targeting the Magic Leap C SDK may be built and run under the Application Simulator, by creating a host program which links against Magic Leap C SDK entry points. But as Magic Leap 2 (ML2) is built on Android (where standalone native graphical applications are not supported), this section assumes your goal is to start from an Android-style project which builds for device and adapt it for usage with the Application Simulator.
A key point is that Application Simulator only covers the C/C++ side of such projects; it does not support Java APIs. Thus, Android projects suitable for the Application Simulator should be native activities which invoke C/C++ logic in a shared library through the help of native_app_glue (see Android's Native Activity documentation for more information).
The Application Simulator can load a host build of this native library and invoke its android_main entry point. Any callbacks to JNI code either need to be stubbed out or replaced with the Application Simulator C APIs.
The permissions system in ml_zi_permissions.h should be used to make permission requests under the Application Simulator instead of their JNI equivalents on device.
Application Simulator Environment Setup
The sections below assume the Application Simulator build environment which publishes an MLSDK environment variable (pointing to the Magic Leap C SDK) and a ML_ZI _ROOT environment variable (pointing to the Application Simulator Runtime). Additionally, PATH and DYLD_LIBRARY_PATH (macOS) need to be established to run programs under the Application Simulator.
All of these steps may be performed by starting a command line prompt from the Magic Leap Hub, which you can open by pressing F8 or by clicking the terminal icon on the bottom left. This terminal will be automatically configured for Application Simulator development.
Manual steps to set up a command line interface for Application Simulator development are to run the following scripts:
source $USER/MagicLeap/mlsdk/<your-os-version>/envsetup.sh
source $USER/MagicLeap/tools/zi/<latest-app-sim-version>/mlvdsetup.sh
Additionally, building C-API samples requires setting up the environment variables ANDROID_SDK_ROOT and ANDROID_NDK_ROOT. The user must have also built the Application Framework for host, and have set the environment variable MAGICLEAP_APP_FRAMEWORK. These steps are covered in the C-API Command Line Workflow guide.
Building C API Apps
Reference the C-API Building Guide for more building instructions to supplement the information below.
An Android app is built for device using gradlew, which (for our purposes) can be split into "native build" and "Android build" parts. The Application Simulator only requires the “native build” parts.
Typically, Android projects contain an app/build.gradle file which contains an "externalNativeBuild { cmake { … } }" section that targets app/src/main/cpp/CMakeLists.txt. The Application Simulator can share the cmake project used to build the native activity code, if the same is built as a shared library for the host.
The C-API samples ship with a build.py script that automates the building of the shared library. The build process places the shared library, the manifest, and the assets into sample specific folders within the out/samples_host_samples folder of the root samples directory.
All samples can be built for the host using python3 build.py --build host on the terminal. If you want to build just one sample, use python3 build.py --build host --project <project_name>.
For example, the shared library and the assets for the controller sample can be found under: <path_to_samples>/out/sdk_host_samples/com.magicleap.capi.sample.controller.
The next section covers launching the shared library.
Launching C API Apps
The shared library built from your app's native source can be launched through a program, ZILauncher, that is distributed as part of the Application Simulator runtime. As with running the Application Simulator, you can launch the program from a terminal (macOS, Linux) or Command Prompt (on Windows). The steps below assume such an environment.
- Set up the Application Simulator build environment.
- Launch
ZILauncherby specifying the full path to the shared library from Building for Application Simulator.
ZILauncher /path/to/shared_lib
- The running Application Simulator instance in the Magic Leap Hub (ML Hub) should report
ZILauncheras connected. Then the app rendered frames should be visible in the Simulator's Device View or the headset if you are using the Device mode.
Launching Standalone Executables
Users can also build standalone executables, for host, against Magic Leap C SDK APIs and Android headers distributed as part of zi_android_sdk in the Application Simulator Runtime folder. Those apps can be directly launched from the command line without using ZILauncher.
Troubleshooting
Looking at the Event Log and Log Files
The Application Simulator separates logging information into an Event Log and log files are saved to your local drive. When you launch the Application Simulator from Unity, the Unity log output goes to the Unity console, not the ML Hub logs.
You can view each of the logs by using the Application Simulator menu options.
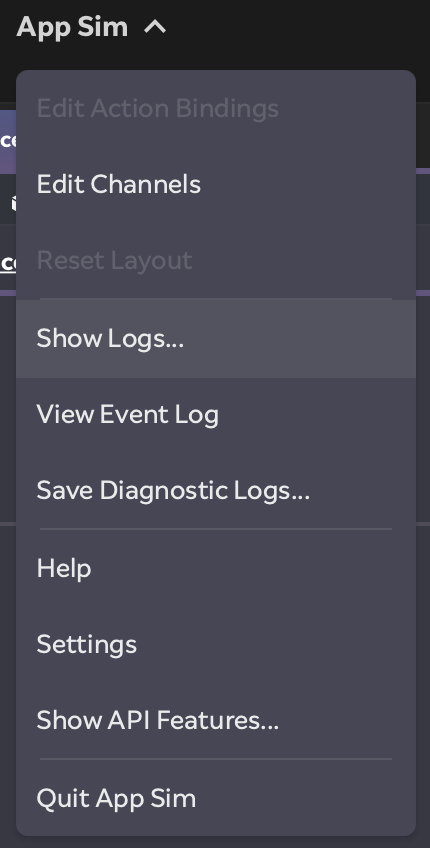
You can bundle all of the logs and runtime/error information by using the Save Diagnostic Logs… button. This is useful for reporting errors encountered when using the Application Simulator. It will generate a .zip file that you can unpack to inspect before sending to Magic Leap Developer Support.
You can control the verboseness of the log files by setting the log level to filter out messages that do not meet a minimum level of priority. The default log level is Info, which filters out all messages below the priority level of Info. Do not use the log level Debug unless trying to reproduce or report a bug, as that slows the Application Simulator considerably.
To set the log level:
- Expand the Application Simulator Activities menu, and then click Settings.
- Select the Log Level.
You may use the following as a template for your message. Remember to attach the .zip of your log files as well:
- OS and Version:
- Graphics card or chipset:
- Details:
- What were you doing when the problem occurred?
- Which mode were you using: Simulator or Device?
- What 3D engine or development platform were you using?
- Add any additional details pertinent to the problem.
Data Your Report File Contains
These log files include diagnostic information from the user interface, the Application Simulator server, and the Application Simulator app, and could potentially contain information that is either proprietary to you or that might identify you in some way. Examples of such information include and are not limited to:
- Your user name
- Path names on your local hard drive
- Any log messages from the ml_logging APIs
- List of installed packages and versions
- ML Hub frontend layout
- Java crash reports
- adb logs from default connected device
- Eclipse/ML Hub logs
- Application Simulator backend logs
- Unity editor logs
Protect Your Privacy
Before sending or attaching the .zip file of the logs to report an error, open the .zip file and view the contents of the logs to make sure you are not sending any information you don't want public.